Popup menus
In Spview, mouse-click interaction is a very popular feature, as it allows access to any number of tools for spectrum analysis. However, depending on the area of the software where the pointer is located, the contents of the open menu may differ.
In data area
Right-click allows to rescale the axes and to set/reset a vertical bar which helps to visualize frequency coincidences.

In prediction/experimentation area
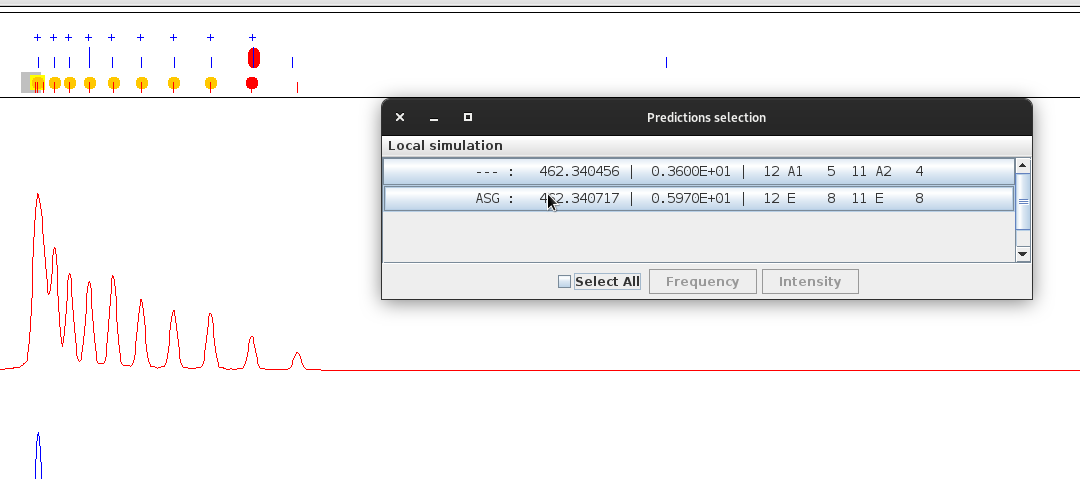
Left-click in experiment area (upper part of the prediction/experiment area) allows to select one experimental peak in a popup list.
The current assigned prediction (to any experiment line) are marked by an orange disc.
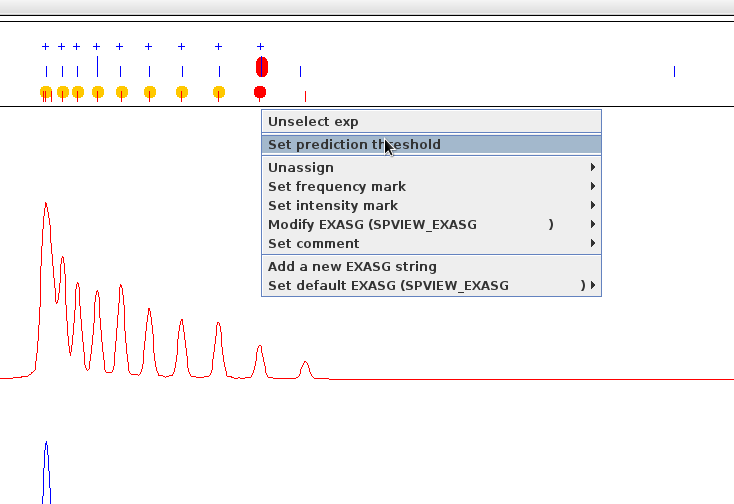
Right-click allows to modify the attributes of the selected experimental peak (assignments, …).
The current selected experimental line is marked by a red oval.
The current assigned prediction are marked by a red disc.
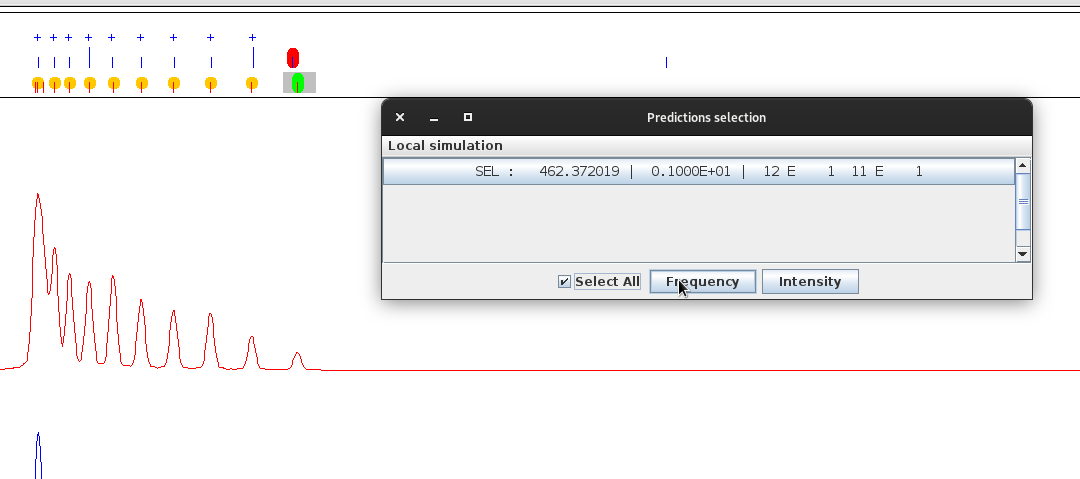
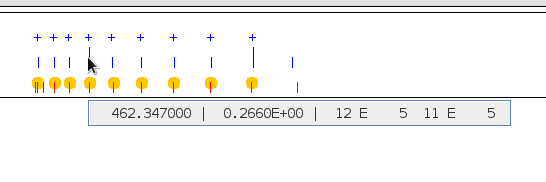
Left-click or left button drag allows to select one or more prediction lines in a popup list.
The current mouse pointed prediction is marked by a yellow square.
The current selected prediction are marked by green ovals.