Main Window
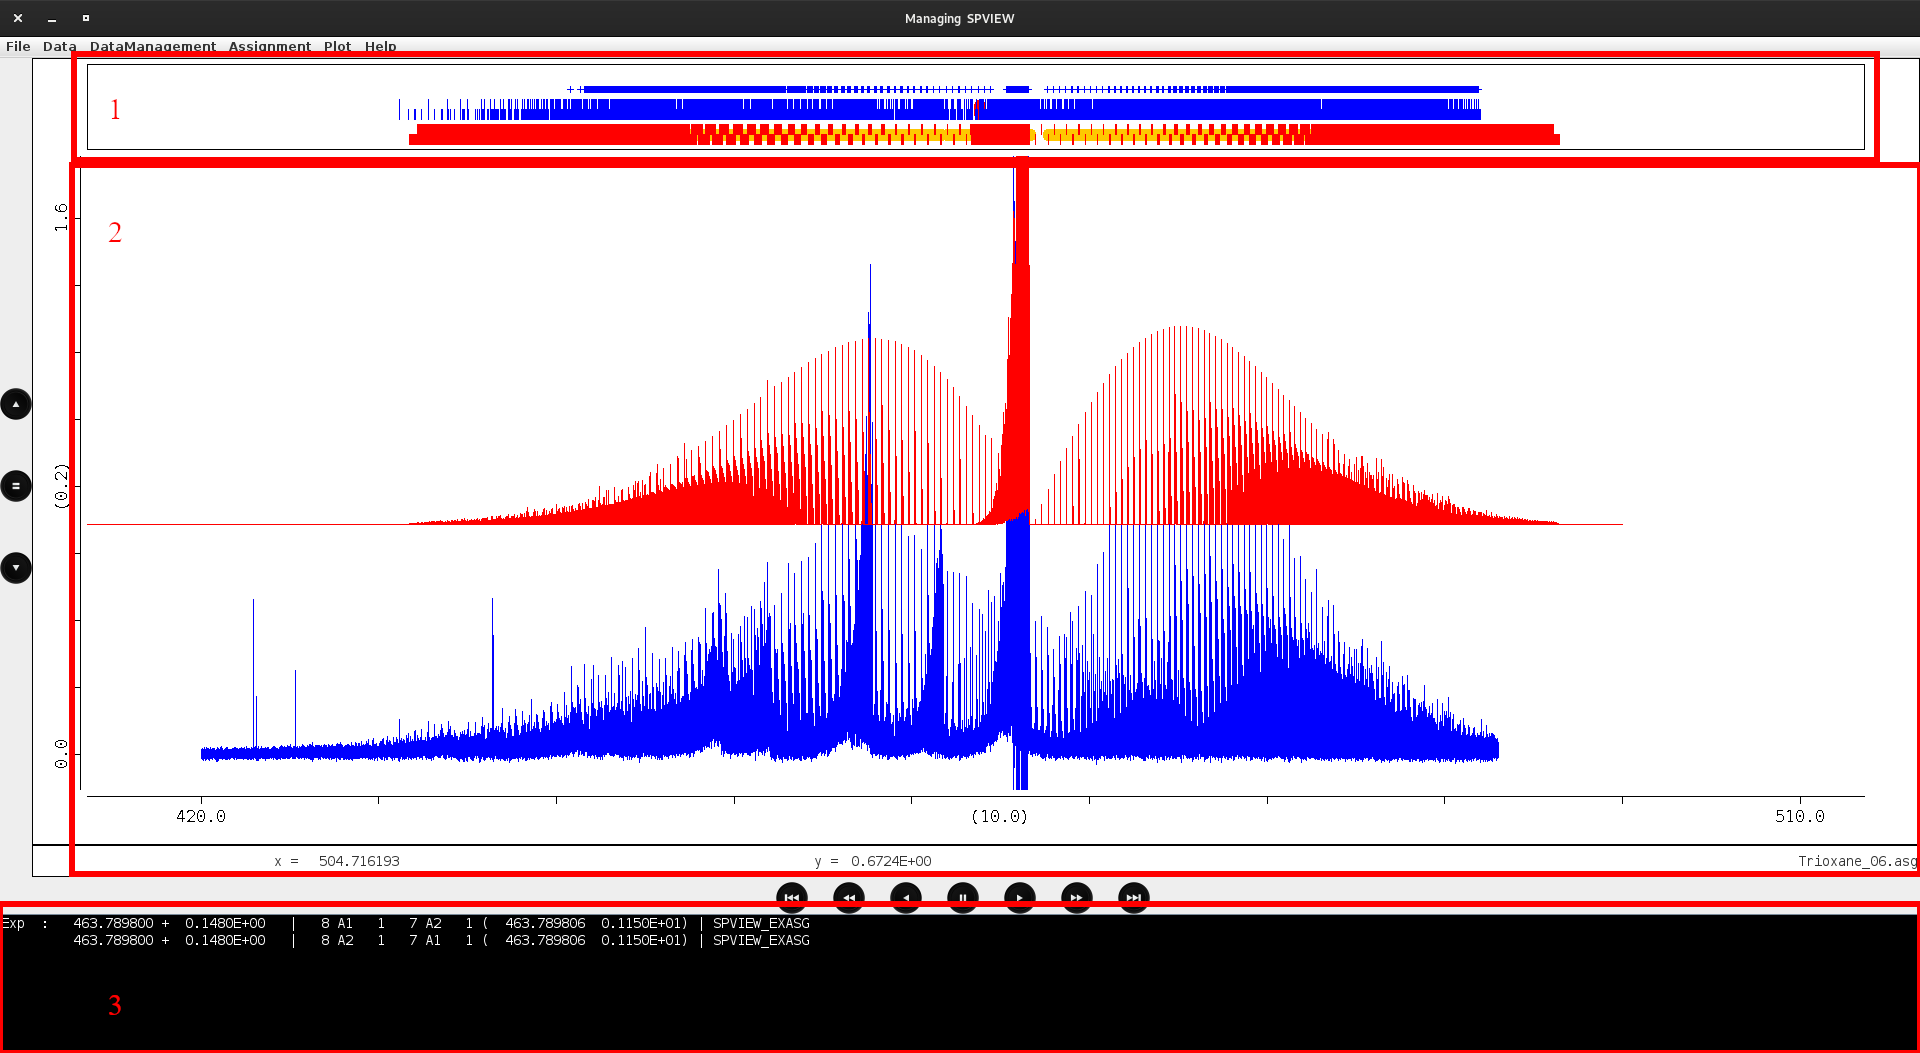
Spview in use. The application is separated into 3 distinct graphical sections. To see more details, click on the image to zoom in.
Here’s what Spview looks like in use. The top panel (1) is where predictions and experimental peaks are displayed. The center panel (2) is the main window in which experimental and simulation spectra are displayed, and finally, the bottom panel shows the selected lines as recorded in the assignment file.
Top panel
This is where experimental peaks (which can be calculated with Spview or any other third-party application) and predictions in HITRAN or TDS format are loaded and displayed. These data are displayed as small sticks and the user is invited to click on them to make assignments, as detailed in the In prediction/experimentation area or Attributing lines sections.
Central window
This panel is probably the most important, as it takes up the most space on the screen. It shows the spectra, generally from experimental and simulated data. Plots can be shown or hidden with the DataManagment menu. Right click is detailled here.
Bottom panel
The bottom panel displays the lines of the assignment file that will be modified, showing the selected experimental lines and the predictions you wish to associate.
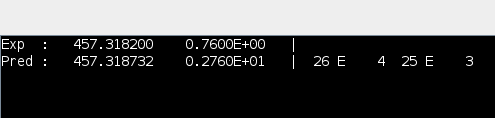
Bottom panel while attributing a new lines. Experimetal position is compared to the prediction.